In a world where trends go viral overnight and creators blow up in just one reel, understanding Instagram Statistics isn’t optional, it is your survival kit.
If you really want to grow, stand out, and stay ahead of the 2026 competition, you must know what the numbers are saying.
Here are what you should know to level up your Instagram strategy…
Quick Instagram Statistics
| Parameters | Quick Instagram Statistics |
|---|---|
| Monthly Active Users (Globally) | 3 Billion |
| Daily Active Users (Globally) | 500 Million |
| Indian Users | 480 Million |
| US Users | 181 Million |
| Average Daily Time Spent | 33 Minutes/Day |
| Global Age Distribution ( Majority) | 62% – 64% of users are aged 18–34 |
| Gender Split (Globally) | 50.6% Male / 49.4% Female |
| Top Country by User Count | India with 480 Million users per month |
Global Instagram Statistics: Users And Growth Trends
Explore how Instagram’s global user base is expanding and shaping major growth trends worldwide in one clear snapshot.
Total Instagram Users Worldwide
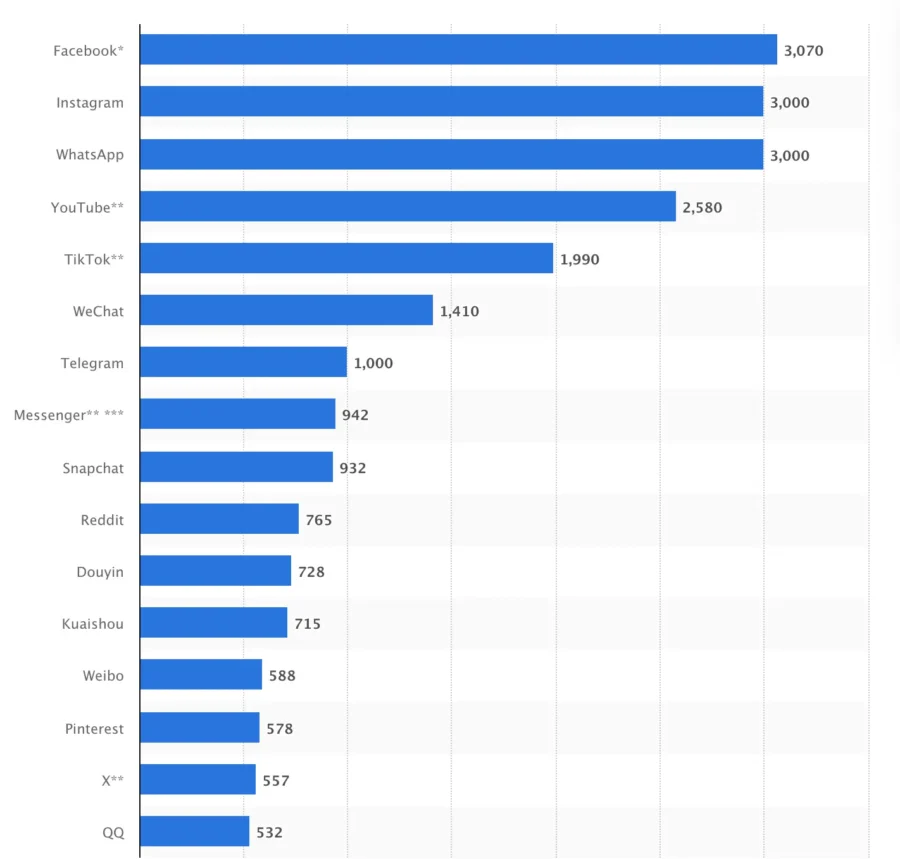
As per the report published by Statista in October 2025, Instagram boasts over 3 Billion users globally which means it is one of the most widely used social media platforms.
Over the past few years, millions of users are going gaga for Instagram because of various features offered.
Instagram stats show that the platform accounts for around 25% of all social media users worldwide which highlights its influence in the social space.
It’s layout is compatible with mobile which ensures that users will have constant access.
Growth Trends Over The Years
Instagram has evolved beyond just photo sharing app.
Moreover the introduction of Stories, Reels, and shopping features in it, increased user retention and attracted new audiences over the period of time.
As per Instagram marketing analysis, its user base has grown by nearly 10% year over year in major markets like the United States and India.
Instagram Stories have become a major driver of engagement. Over 500 million people use Stories on daily basis and around 70% of users watch Stories every day.
In fact, nearly 86.6% of Instagram users post Stories regularly which shows how central this feature has become which promoted daily activity on the platform.
Emerging markets such as Southeast Asia and Latin America are seeing even faster growth, signaling Instagram’s global expansion and adoption.
Monthly Instagram Users Over The Years
| Year | Instagram Monthly Active Users |
|---|---|
| 2025 | 3 Billion |
| 2024 | 2 Billion |
| 2023 | 2.4 Billion |
| 2022 | 2.3 Billion |
| 2021 | 2 Billion |
| 2020 | 1.3 Billion |
| 2019 | 1.1 Billion |
| 2018 | 1 Billion |
| 2017 | 700 Million |
| 2016 | 500 Million |
| 2015 | 370 Million |
| 2014 | 200 Million |
| 2013 | 110 Million |
What Are the Country Specific Instagram Statistics?
Instagram is used all over the world for various applications. But first of all, let’s connect with the top 10 countries.
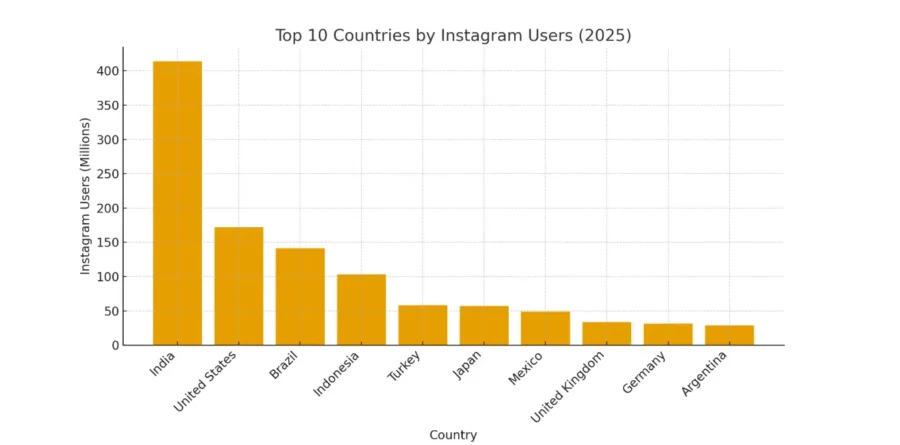
- In 2025, India has the highest number of Instagram users with over 410 million people.
- The United States comes next with about 170 million users.
- Brazil and Indonesia also have a large number of user base, while countries like Turkey, Japan, and Mexico fall in the middle range.
- The UK, Germany, and Argentina have smaller but steady user counts.
What Are The Instagram Demographic Statistics?
Learning Instagram user demographics can be key assets for both marketers or businesses.
What Are the Key Instagram Engagement Statistics?
Here are the key Instagram engagement statistics, explained in a simple and easy-to-understand way:
Time Spent On Instagram
On an average people spend around 30 minutes a day on Instagram. This includes each and every activity, i.e., scrolling through the feed, watching reels or engaging with stories.
As a result, it is a highly engaging platform for consuming content over 3.5 hours a week.
Likes, Comments And Shares
The engagement activities vary with the number of followers. On average, a single Instagram post receives:
Likes: 150 – 200 for individual accounts
Comments: 10 – 15 per post
Shares: Varies widely but often ranges between 5 – 10 shares
These engagement rates are higher for content from popular brands or influencers.
Instagram Stories Engagement
Instagram Stories is one of the most engaging features on the platform. Around 500 million people view them every single day.
Instagram Highlight Engagement
Its Highlights help you in boosting the engagement by keeping your best Stories visible beyond 24 hours. Because they stay pinned on your profile, users often tap through them to learn more about you which makes your Highlights a powerful way to increase views and interaction over the period of time.
Instagram Feed Posts Engagement
Instagram Feed posts continue to attract strong engagement especially when they include high quality photos, carousels or relatable captions. All of them make them a reliable format for reaching your audience consistently.
Instagram Reels Engagement
Instagram Reels are driving strong engagement. Recent studies show that reel get about 22% more interaction than the regular feed videos. This makes Reels one of the most effective formats for boosting reach and visibility.
What Are the Most Important Instagram Statistics for Businesses?
The most important Instagram Statistics for business are as follows:
Instagram Business And Marketing Statistics
Instagram has become one of the most powerful platforms to build the goodwill of the brand. From small local businesses to global companies all depend on it to boost their trust and sales. Today, over 200 million businesses are active on Instagram.
Around 79% of global marketers now use Instagram as part of their campaigns. Many users also shop, research products or discover new brands on Instagram.
Roughly 62% – 63% of the population of the world are now using it to explore brands and products.
Businesses Active On Instagram
More than 200 million businesses are active on Instagram today. Whether it is retail, beauty, food, lifestyle or B2B services this platform provides endless opportunities to reach a global audience.
In today’s time many brands are relying heavily on Instagram for product launches, brand storytelling, and community interactions.
Percentage Of Users Following Brands On Instagram
More than 80% – 90% of people on Instagram follow at least one brand which shows how open users are to discovering and connecting with businesses.
That makes Instagram a powerful platform for building brand credibility because there is a good chance of your content that it will find an audience who is already interested in brands.
Influencer Marketing Stats
Influencer partnerships continue to grow. Here are some key Instagram marketing stats:
- Instagram is responsible for up to 70% of influencer partnerships worldwide.
- Nano and micro-influencers (1k – 100k followers) have higher engagement rates which make them ideal for brand collaborations.
- Influencer content generates up to 4 times higher engagement than traditional brand posts.
Many brands use influencers not only for awareness but also for direct sales through affiliate links and Instagram Shops.
Instagram Ad Performance And ROI
In this digital era, where all the businesses are competing with each other to promote their products and generate a better ROI out of it, instagram ads play a vital role in boosting the performance of marketing.
Recent studies shows the following shocking results:
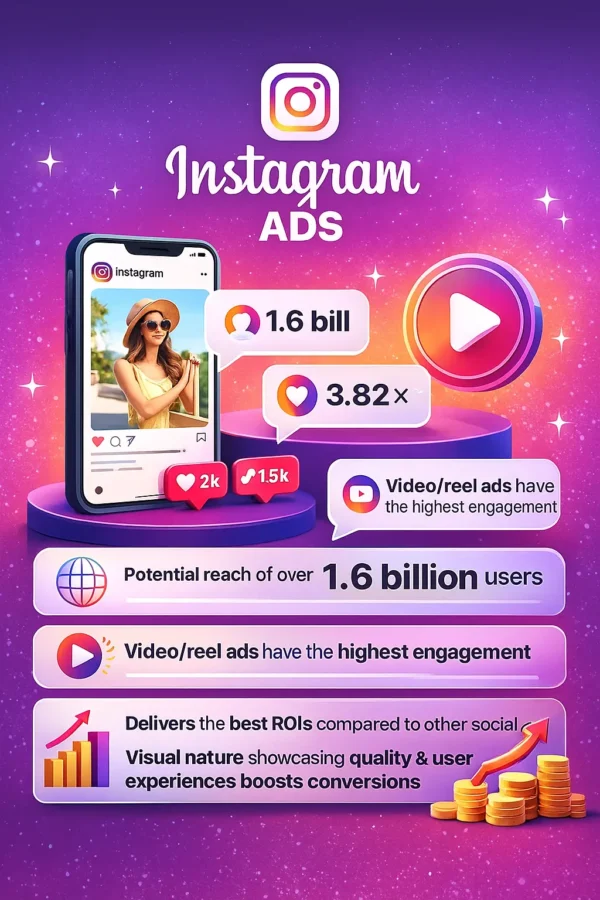
- Instagram ads have a potential reach of over 1.6 billion users.
- Video ads or the Reel ads have the highest engagement.
- Instagram delivers the best ROIs as compared to other social media platforms.
Its visual nature helps brands showcase product quality, features, and real user experiences, leading to stronger ad conversions.
Instagram Shopping And E-Commerce Adaptation
Instagram Shopping has transformed it into a full e-commerce hub. In recent research, Instagram statistics show:
- Over 130 million users tap on shopping posts every month.
- Those brands who are using the product tags see higher click through rates (CTR).
- By making the process as simple as possible, Instagram Shop helps users discover and purchase products quickly.
- For brands that sell physical products like apparel, accessories, beauty items, home decor, and more, the platform works well.
Which Content Trends Are Dominating Instagram?
For businesses or influencers, it is important to know which content performs best and allows them to tailor their strategies. For this they need to know what types of content they can actually upload on it.
Instagram statistics clearly show that visual storytelling continues to dominate.
Most Popular Types Of Content On Instagram
These formats lead the way:
- Reels
- There is no doubt that reels are the most engaging source of content on Instagram
- People love to watch short and fast paced content which ultimately reach more viewers than those which are long or slow.
- Stories
- With over 500 million daily users on instagram, stories remain one of the most consumed formats because it will take a millisecond to view the story of anyone.
- Image Posts
There is no doubt that image posts are one of the most trusted and effective ways to engage audiences on Instagram. But why?
Let’s spill the tea on it…- Sharing high quality or aesthetic images can attract strong interaction.
- Brands use image posts to showcase their products, share their lifestyle content, give behind the scenes (bts) or the glimpses to gain the trust of the targeted audiences,
- Pairing a compelling caption with a great image can increase saves, shares, and overall reach.
- Carousel posts
- These posts are often perform even better because users spend more time swiping through multiple images.
- User-Generated Content (UGC)
- Today, influencer marketing is booming. When a trusted influencer shares their own experience or recommends a product, it helps everyday users to trust the brand.
- Hence, it boosts the credibility of the brand and makes it more likely they’ll engage or make a purchase.
What Are The Best Timings And Frequency on Instagram?
General Instagram statistics show that:
- The most effective posting times are generally between 9 AM – 12 PM and 6 PM – 9 PM.
- Brands that post 3 – 5 times a week usually see more steady and consistent engagement.
- Reels tend to perform best when they’re shared during busy evening hours, when more users are active.
Top 5 Instagram Accounts Statistics
| Instagram User Name | Followers Count |
|---|---|
| Instagram Official Account | 697M |
| Cristiano Ronaldo | 668M |
| Lionel Messi | 510M |
| Selena Gomez | 416M |
| Kylie Jenner | 391M |
Some Interesting Facts About Instagram You Should Know
- Instagram reached its first 1 million users in just 2 months.
- The very first photo on it was of a dog.
- Instagram was originally called “Codename”.
- Most of its users prefer Stories over feed posts.
- It hit 100 million monthly users faster than Facebook and Twitter.
Conclusion
Instagram is not only a social networking site. It is an effective marketing tool backed by trustworthy data. Once you have a firm understanding of your audience, you can publish content that is effective.
Whether you are a business owner, marketer, artist or someone interested about the digital world it is very crucial to understand your Instagram analytics to take the strategic advantage.
With the aid of its upgraded features you may improve your brand, stimulate more engagement and reach a larger spectrum of audience.
Any firm must keep up with the latest market data and Instagram facts in this quickly expanding digital arena.
In today’s world, people are shifting towards OpenAI tools more than ever. They are actually spending a lot of time using them for learning, creating, and solving problems.
If you want to become a pro, here are some ChatGPT Statistics you should know before becoming a master.
How often should you review Instagram statistics?
You should check Instagram statistics at least once a month to track performance trends, build new strategies and measure the success of regular content. For targeted campaigns you should review weekly to improve data-drive results.
Differentiate between Instagram Reel Statistics and regular post statistics?
Instagram Reel statistics focus on metrics like views, plays and average watch time. Whereas, regular post statistics track likes, comments and saves which reflect audience interaction with static posts.
Which metrics should I track on Instagram?
Key metrics include engagement rate such as likes, comments, shares, saves, reach, impressions, follower growth, profile visits, views and average watch time.
Can Instagram statistics help improve content strategy?
Yes, analyzing statistics reveals what type of content your audience prefers, the best times to post, and which campaigns drive the most engagement etc.
